D3 Visualizations
Animated Bar Chart Races, Sunbursts and Maps from a Simple CSV
Some stories need more than a bar chart: rankings that change over time, a hierarchy you can zoom into, a tour of locations on a globe. The D3 Visualizations Wizard builds them from a few CSV columns, with no D3 programming.
What's inside: bar chart race, zoomable sunburst, zoomable circle packing, collapsible tree, world tour map, animation speed, number of bars, color schemes, tree layout, map projection, standalone HTML export.
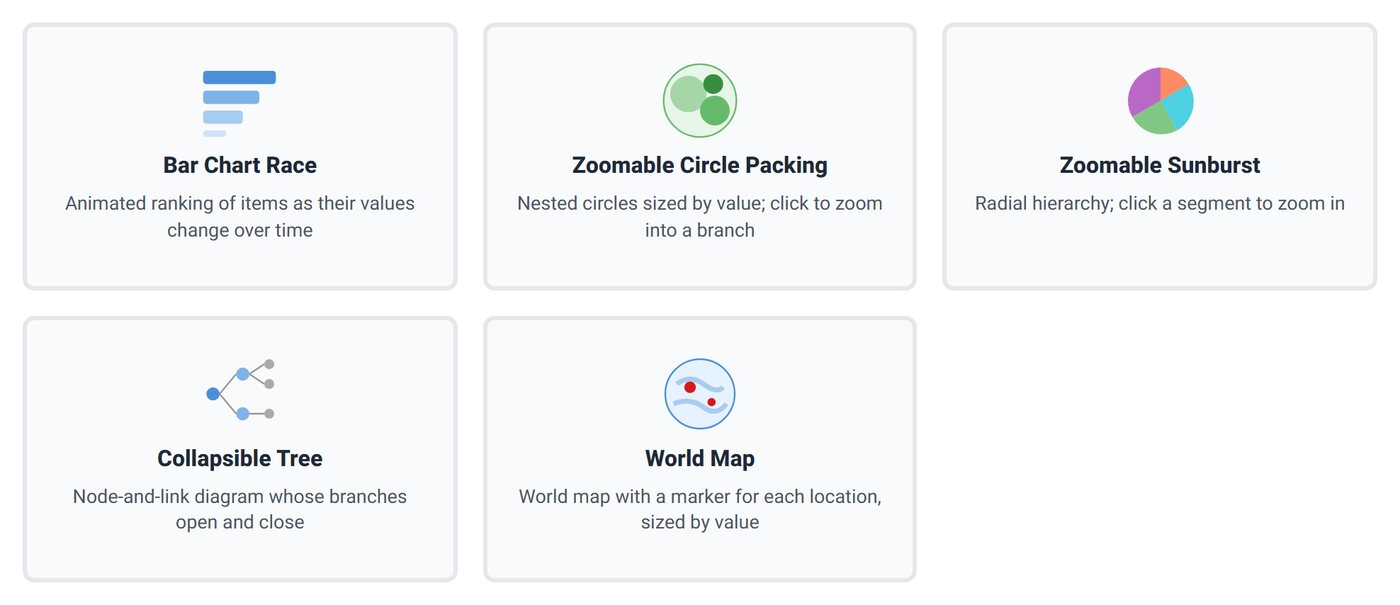
Five Visualizations
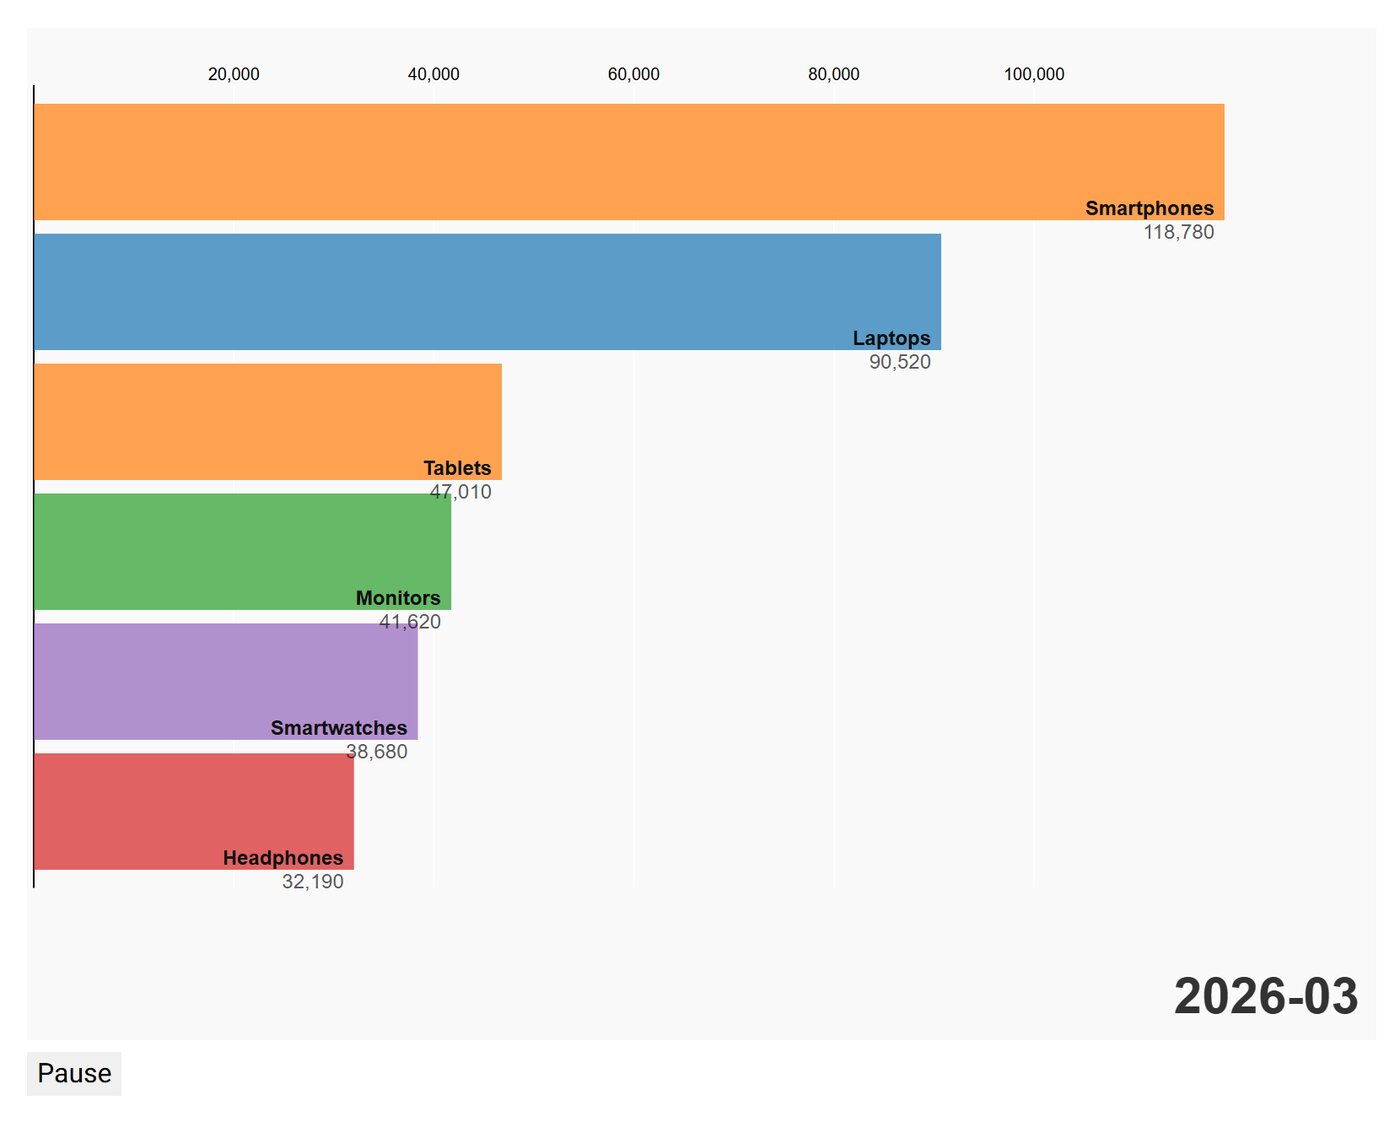
Bar Chart Race
Show how a ranking changes over time: sales by product, visitors by country, votes by candidate. Columns: name, value, date, and an optional category.
Zoomable Sunburst
A hierarchy as rings. Click a slice to zoom into it: budgets, product catalogs, site structure. Columns: name, parent, value.
Zoomable Circle Packing
The same kind of hierarchy as nested circles, sized by value. Click to dive in and back out.
Collapsible Tree
Org charts, family trees and decision trees that visitors open branch by branch. Columns: name and parent.
World Tour
Travel from place to place on a map: offices, events, customers or shipments. Columns: location, latitude, longitude, value.
How It Works
- Choose a visualization. The wizard shows the required columns, marked with an asterisk.
- Add your data as CSV, or generate random data to see the effect first.
- Tune it: title, size, animation duration, number of bars, color scheme, tree layout or map projection.
- Use it on your Joomla or WordPress site, or export it as standalone HTML or a JSON configuration.
Good Fit For
Annual reports and "year in review" pages, data journalism, school and university projects, NGO impact pages, company history and org charts, and event or office locations around the world.
Questions
Do I need to know D3.js?
No. The wizard writes the visualization; you supply the columns it asks for.
How is this different from the Chart Wizard?
Charts cover everyday line, bar and pie charts. D3 visualizations are for animation over time, hierarchies and maps.
Can I use it outside my website?
Yes. Export a standalone HTML file and open it anywhere.
Which membership includes D3?
The D3 Visualizations Wizard is in Silver (6 months, €58) and Gold (12 months, €96).
Watch the Bar Chart Race
Play, pause and explore every D3 visualization on the demo page.